Last Updated: February 10, 2021
Welcome to your Prevedere Predictive Indicators Dashboard
Prevedere offers a number of different intelligent forecasting services. One of our most popular is the new Economic Outlook Weekly reports that track leading indicators having to do with the COVID-19 pandemic or one of our Economic Outlook Weekly reports that track industry-specific indicators.
In times of elevated uncertainty and broken forecasts, we understand that planning for the future will be challenging for the remainder of 2020 and beyond. The US is moving through an economic recession as a result of the COVID-19 global outbreak. With relentless news cycles and thousands of data points one could follow to capture this unprecedented event, it can be challenging to know what to focus on. To answer this problem, our Economist team has handpicked a set of indicators that we feel are critical leading signals for the economic recovery following this economic downturn.
The intention is to provide businesses with the key “leading indicators” that typically turn early in the business cycle, and therefore provide clues to a coming change in the economic environment. The selection of indicators is based on a combination of factors, including leading historical reliability, relevance to the current crisis, and frequency and timeliness of release date for the data. Judging by these three criteria, specific indicators become much more valuable for a business to watch than others.
Historical leading reliability
Some indicators have value because of their consistent ability to signal economic downturns and recoveries throughout past business cycles. There may not have been many economic signals for this recent downturn, because of the sudden-health related nature of the event. But this does not mean there will not be early clues of recovery from economic indicators that have traditionally signaled recovery months ahead of others. For example, Average Hours Worked is an excellent leading indicator and can signal future potential changes in the unemployment rate, as hours tend to be cut before people are laid-off. Similarly, Hours Worked of existing employees rise before hiring begins. Therefore, Hours Worked may be a better indicator to watch than the unemployment rate depending on our needs.
Relevance to the current crisis
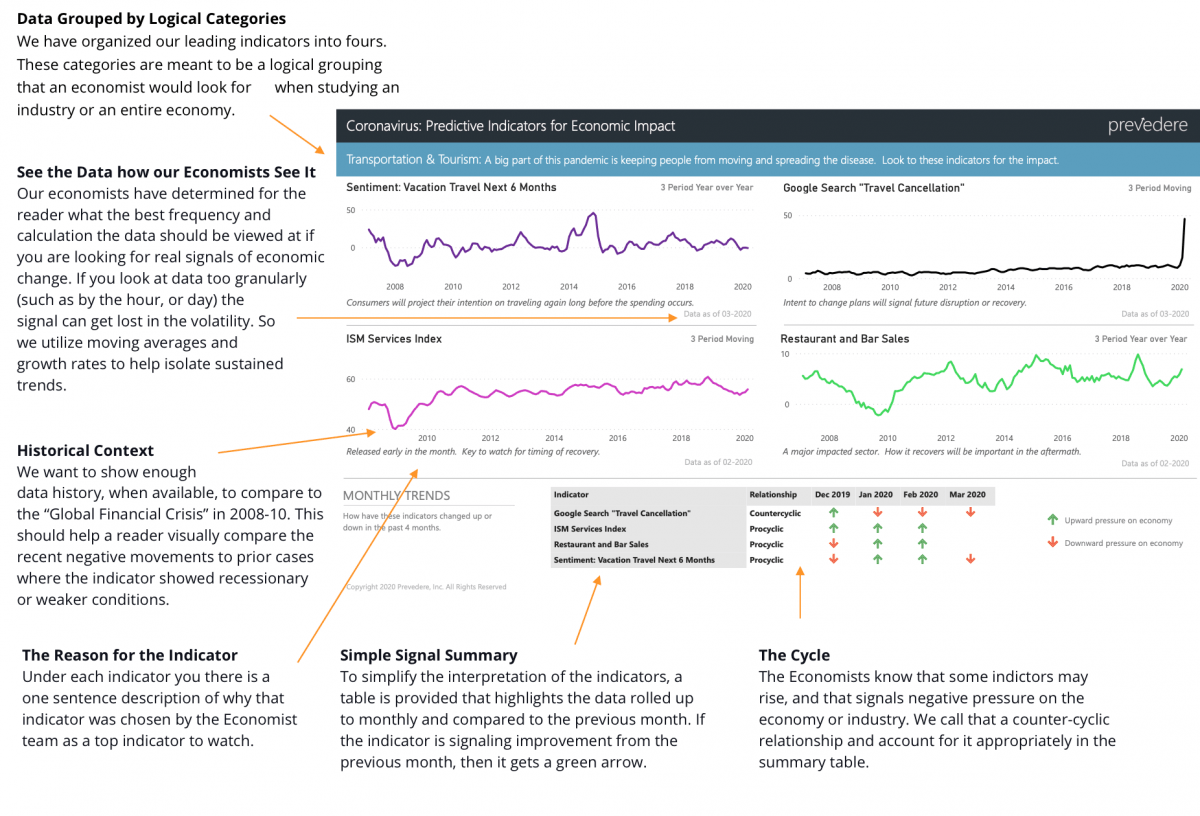
Every recession is different, and this economic crisis is particularly unique because it originated through a global health pandemic, unlike anything we have seen in our lifetimes. We have selected some indicators based on their unique relevance to this crisis, such as historical data on Google Trends searches for “Travel Cancellations” due to the shelter-in-place policies. We are also watching Restaurant and Bar Sales, due to closures or restricted operation as non-essential businesses. We may see leading indications from a dataset surveying Vacation Plans in Next Six Months, as a leading clue to when consumers will return to traveling, long before they arrive at the hotel and spend the money.
Frequency and Timeliness of Data
Due to the forced measures put in place to curb the health pandemic, we have witnessed an unprecedently swift change in economic conditions. We have selected several choice indicators based on their “first mover” status as being either real-time or near real-time (daily, weekly measures), to help our readers get a realistic view of current events.
Many traditional government data sources publish data on a monthly basis or even less frequently. And while some of these monthly datasets are still valuable to watch for economic reasons, we try to pair them with other, more frequently released datasets that will help signal current conditions faster.
A good example is that we find value in looking at the VIX Volatility Index for a measure of uncertainty amongst investors, and therefore uncertainty in their expectations about future economic conditions. We also look at the NFIB Small Business Sentiment Index. The VIX has the benefit of being a real-time daily metric, compared to the Small Business survey, which is a monthly survey. Both are worth watching for the future recovery, but the VIX will be helpful for early signals in the days before the NFIB survey data is released for consumption.
***
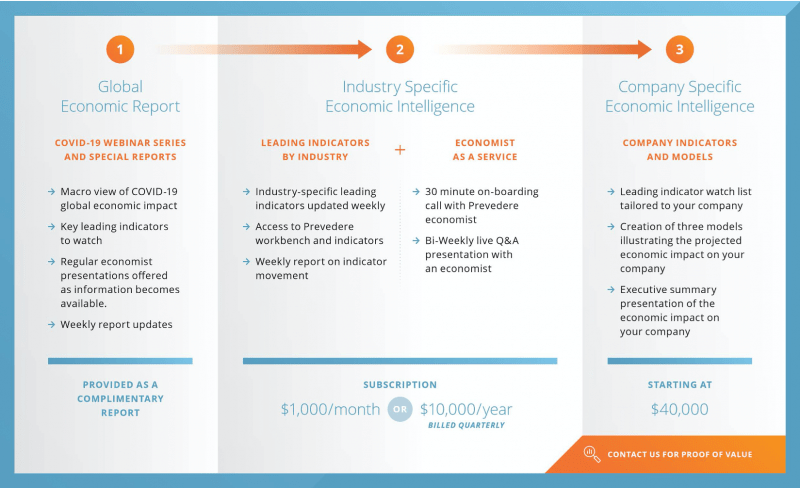
Economic Outlook Weekly Subscription Services
Package 1 – Complimentary Global Economic Report
- Macro view of COVID-19 global economic indicators
- Regular economist presentations offered as information becomes available
- Updated weekly to your inbox
- Learn More >>
Package 2 – Industry-Specific Economic Intelligence
- Industry-specific leading indicators updated weekly
- Access to Prevedere workbench and indicators
- 30-minute 1:1 on-boarding call with Prevedere economist
- Bi-Weekly live Q&A presentation with an economist
- Get Started >>
Package 3 – Company-Specific Economic Intelligence
- Industry-specific leading indicators tailored to your company use case
- Custom economic models illustrating the market impact on your company
- Executive presentation on economic forecasts for your company
- Contact us for more information >>