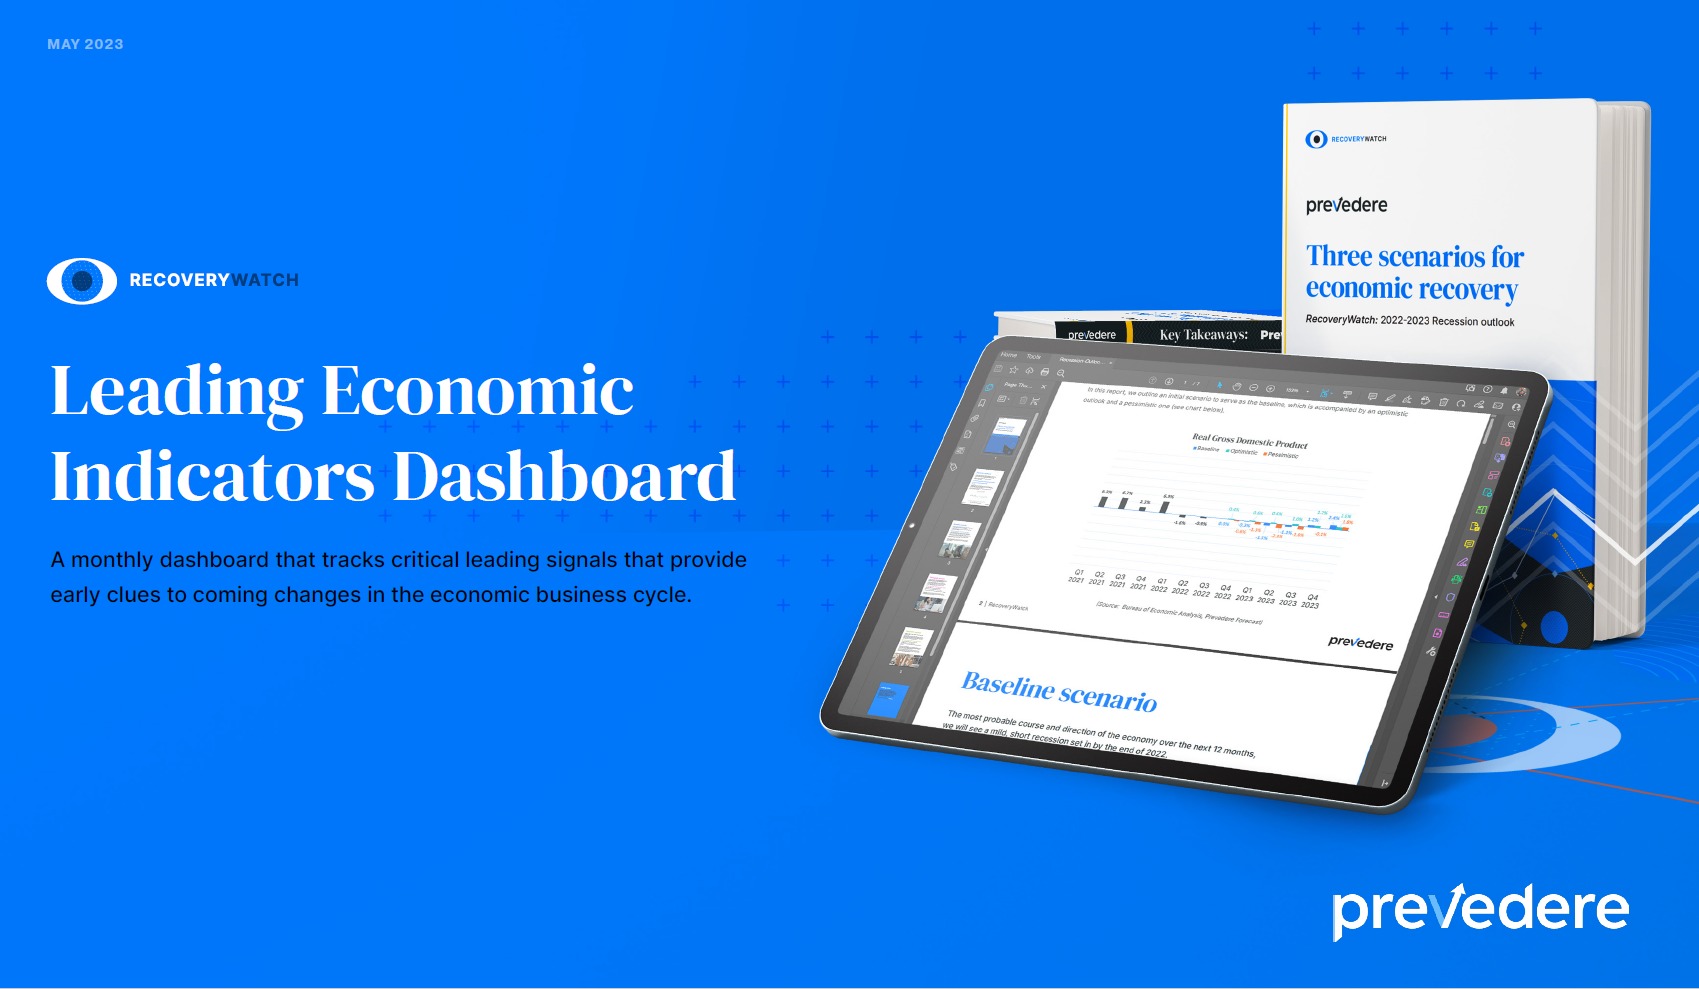
 The May Leading Economic Indicators Dashboard is a report with the leading indicators from May to give business executives insight into the state of the U.S. economy. The dashboard provides a monthly in-depth, economist-led data report on the latest cyclical drivers to signal where we are in the business cycle and when we will reach a point of recession and recovery.
The Leading Economic Indicators Dashboard visually compares recent movements to prior recessionary conditions across various industries to provide at least a quarter of lead time to help business leaders implement changes for intelligent business forecasting. The Prevedere’s team of economists chose every economic indicator in the dashboard and organized them into four categories: consumer spending, financials and prices, production and construction, and consumer and business sentiments.
The dashboard includes:
- Snapshot of the economy
- Executive Summary of the current state of the economy
- Category Indicators placing pressure on the economy
Download the dashboard to learn more.
***
About Prevedere, Inc.
Prevedere is the world’s leading provider of predictive analytics technology and solutions based on econometric modeling, enabling intelligent enterprises to understand and quantify the impact of external factors as part of their strategic planning and forecasting. Our global data repository and patented AI platform enable financial executives and operational planners to identify market drivers, quantify the future impact of economic volatility, generate performance forecasts, and optimize plans based on market foresight.
Prevedere’s automated AI model monitoring provides an early warning system when unplanned market shifts and anomalies are predicted, enabling planners to future proof business performance. Many of the world’s leading consumer packaged goods, retail, logistics, and manufacturing companies leverage Prevedere to generate economic intelligence, spot market opportunities, mitigate risks, and deliver exclusive competitive advantage.