 Prevedere has been acquired by enterprise planning leader Board.
Last Updated: April 9, 2020
By Kim Chase, Senior Economist at Prevedere, What Consumer Credit and Debt Levels Tell Us About the U.S. Consumer
***
Nothing keeps the economic wheel spinning better than the consumer, but there’s a fine line between healthy spending and that which is dangerously debt-fueled.
So, what can consumer credit and debt levels tell us about this critical piece of the economy? Most importantly, this data gives us insight into consumer financial health and willingness to spend, especially on big-ticket and non-essential items. To put this data into perspective, we make comparisons to the 2008 mortgage crisis, which highlighted serious underlying issues in household debt that have become important signals of downturns in overall economic activity.
Here’s a quick snapshot of where consumer finances stand as we move into the new decade:
- Total outstanding credit balances have been steadily rising for five years and in nominal terms are now $1.3 trillion higher than the previous peak in Q3 2008, though this is not as scary as it sounds once we take a look at the details compared to the crisis.
- Revolving credit provides some insight into consumers’ day-to-day spending (credit cards, lines of credit) has not yet recovered to pre-2008 levels.
- Nonrevolving credit involves more long-term debt accumulation and payoff and has become more of a burden for consumers, mostly due to an increase in the volume of student and auto loans. Delinquency numbers suggest that consumers are having more trouble paying off these loans compared to other types of loans.
- The number of credit inquiries within the past six months – an indicator of consumer credit demand – is still lower than before the 2008 crisis.
- Credit standards remain tight, requiring higher average credit scores for most loan types compared to pre-2008 requirements, making it more difficult than before the crisis for some people to get loans, but ultimately protecting lenders from another meltdown similar to that in 2008.
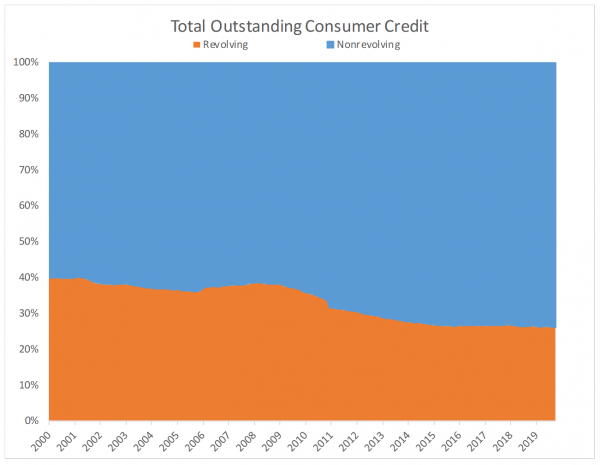
The chart above shows the breakdown of total credit split between revolving and nonrevolving. The share of nonrevolving debt among consumers has increased throughout the past ten years as individuals struggle with accumulating big-ticket loans (e.g., student loans), limiting their willingness to take on other debt (e.g., credit cards) to fuel their normal day-to-day spending. In general, a more balanced split between the two implies a healthier consumer, and therefore, a healthier economy.
If the 2008 crisis taught us anything, it’s the importance of looking for the warning signs in the details:
- Mortgages still make up the majority of household debt, but conditions have improved significantly throughout the recovery and the actual number of mortgage loans is far lower than credit cards and auto loans.
- Consumer credit card debt is stable. This component is the key indicator to watch for everyday consumer spending, not just for big-ticket items.
- Student loans are growing faster than any other debt component and probably poses the biggest risk to spending on big-ticket items (e.g., delayed home-buying). However, this is not as likely to impact day-to-day spending.
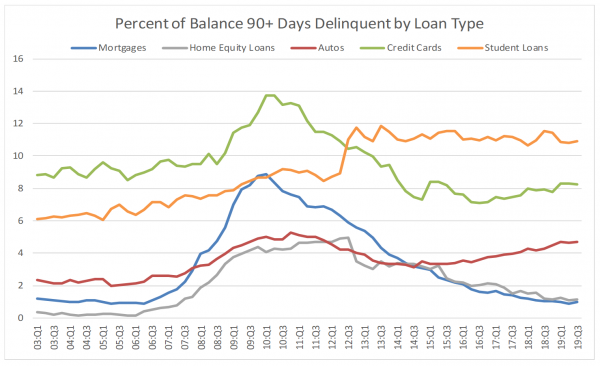
The chart below suggests that late loan payments have improved significantly since the crisis, except for student and auto loans where delinquencies have been rising. This could become a serious issue if the trend continues.
Of all consumer loan types, most red flags are coming from auto accounts[2]:
- Auto loans are on the rise, but more buyers are rolling over prior debt onto new loans (33% in the first nine months of 2019 vs. 28% five years ago and 19% in 2009) with an average debt rollover of nearly $5,000.
- Of the 33% of consumers rolling over prior debt, they financed vehicles with an average loan value of $39,105 even though the average price of vehicle purchases was only $33,312. And these loans carried an APR of 7% vs. 5% for those with no debt carryover.
- The terms on auto loans are also changing, potentially signaling some trouble ahead. The average term for auto loans is 68 months, but terms with 72 and 84 months are becoming much more common.
What’s the moral of the story here? Despite some warning signals with student debt and auto loans, overall consumer finances are stable. Furthermore, inflation and interest rates remain favorable for healthy consumer spending (Stay tuned for more on these topics in future reports!). Businesses should be optimistic that consumers are still willing to take on debt, and financial institutions are still willing to extend it, as we head into 2020.
[1] Source: https://www.newyorkfed.org/microeconomics/hhdc.html
[2] Source: https://www.wsj.com/articles/a-45-000-loan-for-a-27-000-ride-more-borrowers-are-going-underwater-on-car-loans-11573295400
