Last Updated: April 21, 2022
Challenge: Planning in an Increasingly Volatile World
CPG, like many other industries, is facing an increasing challenge from market uncertainty and change. Consumer behavior is impacted by events beyond the control of organizations, highlighted by the incredibly disruptive COVID pandemic.
Even in our world of data-driven planning, basing predictions and forecasts mostly or entirely on internal data is just not going to cut it anymore. While marketing, promotions, and merchandising can affect future sales, consumer behavior is also driven by factors such as weather, health, wages, cost of fuel, consumer sentiment, and much more. Demand is also affected by supply chain efficiencies and disruptions, adding more weight to the need to plan for influences outside the 4 walls of your business.
Without an accurate prediction of the future, the ability to gain market share, allocate resources and optimize working capital is at tremendous risk. The Institute of Business Forecasting and Planning states that demand forecasts are off by a staggering 37% on average, resulting in excess safety stock, poorly timed promotions, and market share loss.

It is now possible to quantify and plan for external forces and fluctuating market dynamics. The process is being termed Intelligent Forecasting, and it has emerged thanks to the perfect gathering storm of big data, artificial intelligence and the scalable power of cloud computing. Machine learning has supercharged the ability of forecasters to leverage econometric modeling at scale, to the point where accurate performance predictions are possible, based on millions of economic leading indicators and model refinements.
That was something of an analytical mouthful, but the bottom line is that it is actually possible to predict your future performance by identifying the leading indicators that correlate to your business performance – whether at total, platform, product or category levels. In fact here is a summary of the 2 key steps in quantifying volatility:
Step 1 – Which Economic Drivers Impact Your CPG Business?
Intelligent Forecasting starts by correlating millions of economic and industry data sources to CPG historical performance, e.g. 3-5 years of sales data for the cosmetics category. Several leading indicators will be identified as most predictive for the layer of business under review, for example:
- Real Average Hourly Earnings
- Prevedere CPG Industry Leading Indicator
- Consumer Price Index (Nondurables)
- Real Trade Weighted U.S. Dollar Index
- Cass Freight Index: Shipments
- Supply Management New Orders Index
- NFIB Small Business Optimism Index
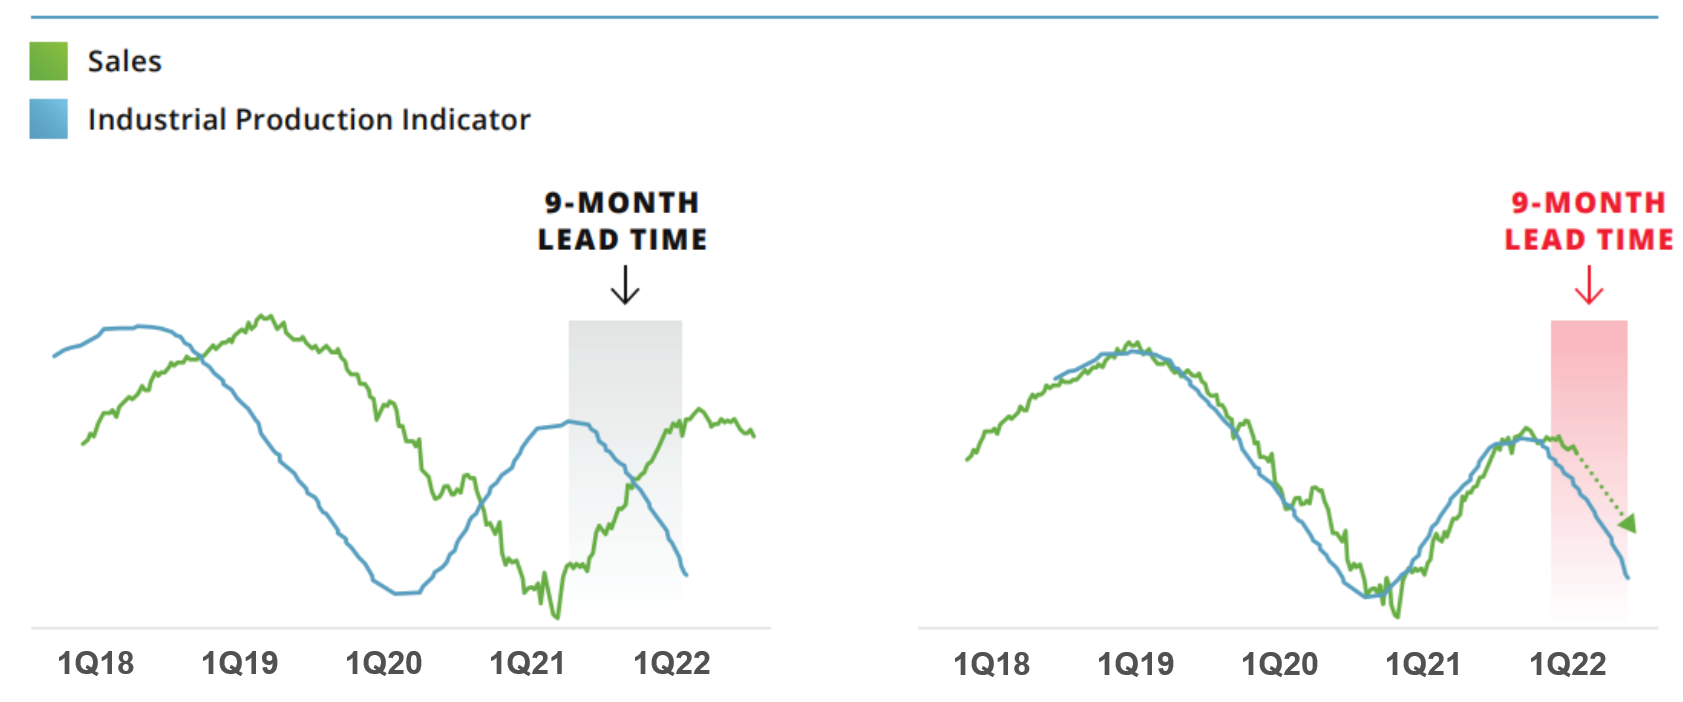
Prevedere is able to help CPGs identify these leading indicators, by providing a repository of model ready data sources, including macroeconomic, demographic, social, industry, weather, financial and government time series. For example your cosmetics sales history is compared to over 3 million time-series data sources in the Prevedere repository, and the correlation analysis will reveal those sources that statistically match (either positively or negatively), that also present a lead/lag signal for predictive use. For example, this industrial production indicator maintains strong correlation and we can see it leads this company’s sales by 9 months.
The analysis might initially present hundreds or thousands of prospective indicators, that can then be filtered by correlation strength, and by context, e.g. geography, industry, scope, channel. The outcome might be 10-30 market drivers that are closely related, each with its own lead/lag timeframe, anywhere from 1 month to 18 months. Clients are often surprised by indicators that are predictors of their business. Some are obvious, others less so, e.g. wage increases before luxury good purchases, employment in garden supply stores as an indicator of propane tank sales, alcohol consumption as an indicator of construction staffing levels. Bottom line is that each company, each brand and each category has a unique set of leading indicators that most consistently happen in advance of the company’s own change in performance.
Step 2 – Create, Test and Refine Prediction Models?
This step involves taking the leading indicators and building predictive models, which ultimately results in the generation of an economic baseline forecast. Sounds simple enough, but this is where machine learning algorithms and computing power excel. First of all, which of those 5-20 indicators do you decide to include in the econometric analysis to accurately determine the 12-18 month prediction, or 3-5 year CAGR? One approach might be to experiment, and build multiple models, but this is an arduous process if you are looking to code this in R or Python and build/test models one at a time.
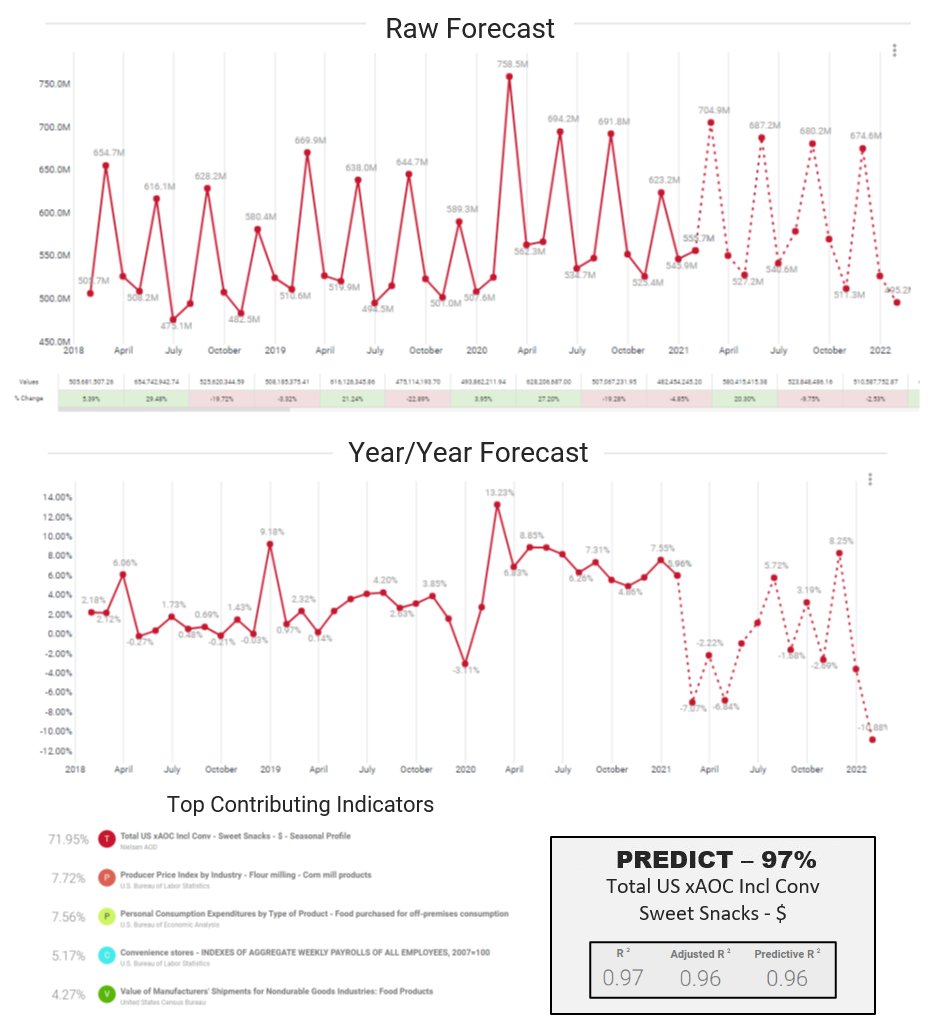
The Prevedere analytics engine creates hundreds of predictive models based on various permutations and combinations of those indicators. Machine learning algorithms enable each subsequent model to learn from the last, reducing errors until the model with the best score is presented. Below we see the results of a predictive model for a Snack Food CPG, in this case a forecast for Sweet Snacks in the US. From 60 months of sales data, Prevedere identified the top contributing indicators, then created / tested / refined multiple predictive models. The top scoring model, in this case, has a R squared value of 0.97 which was back tested to be 97% accurate.
The resulting forecasts (raw, year over year, CAGR) were then incorporated by the FP&A team into the planning process, benchmarked with the internally generated predictions, and adjustments made. Forecasts, variances and leading indicator projections provided category management and leadership with invaluable insights to refine plans, resulting in increased profitability and competitive foresight.
Intelligent Forecasts are often integrated into planning and ERP systems, or even analytics systems for downstream use. Prevedere has created risk and impact dashboards that enable a real-time view of forecasts and impact. Models can be refreshed at any time, typically as internal and external data sources refresh. Data-driven monitoring of future operating conditions is now possible.
Bottom line is that an Intelligent Forecast tells a story, not just of the monthly or quarterly future data points, but of the upcoming winds in the economy. With insight into the causal factors of a forecast, strategic planners and executives can plan with confidence for upcoming headwinds and tailwinds:
Content Recommendations
- eBook – Intelligent Forecasting for the CPG Industry
For more in-depth information related to the above post, read our latest eBook.
Thanks for your time today.