Last Updated: February 10, 2021
The impact COVID-19 (coronavirus) is having on lives around the world is sobering. Equally important is the immense complexity in combating and stabilizing the spread of this virus.
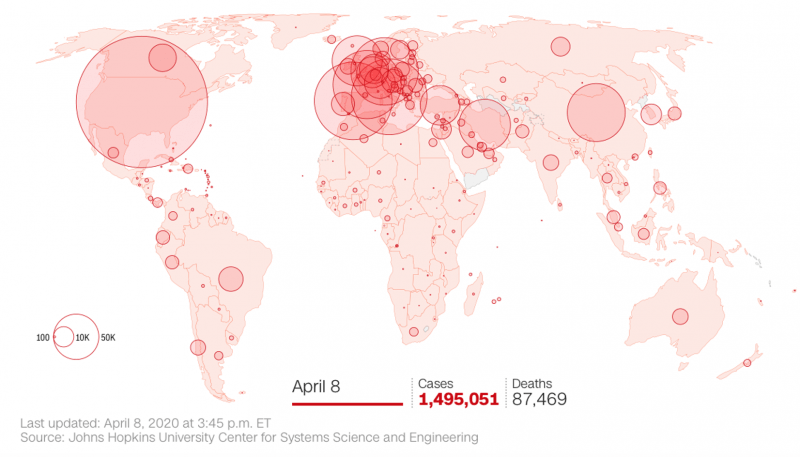
The number of confirmed cases since the 100th confirmed case provides great context for where the United States sits today as we’re going through what could be some of the worst weeks in terms of the number of new cases and potentially deaths in the United States. This has already been experienced in other parts of the world, as this crisis started in Asia and quickly shifted to Europe and then North America with effects making their way into emerging markets.
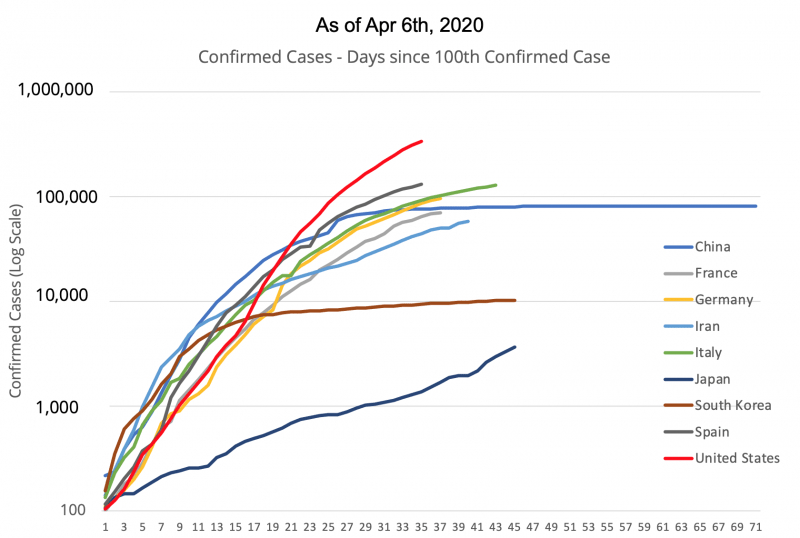
The number of new cases in the U.S. has elevated to the top of the scale, with the total number of confirmed cases higher than any other country. The obvious goal is to bend this curve and ultimately halt exponential growth of new cases as has been going on since the early days. We have long talked about one of the critical questions: Can we look to Asia and possibly Europe as clues for what’s to come in the U.S.?
To mimic what is going to happen in the United States from an economic crisis perspective, we would generally look at leading indicators that often signal recessions one, two, three quarters in advance. Through this crisis, those indicators were virtually useless because of the rapidity of the economic downturn. We’ve been through a shock factor, a lot like a light being switched from on to off. The U.S. economy was humming along with relatively strong GDP growth and consumer spending right up until we were all told to practice social distancing, and then to close nonessential businesses, and finally to shelter in place. In what was quite literally over-night, the economy was flipped upside down spiraling into recession.
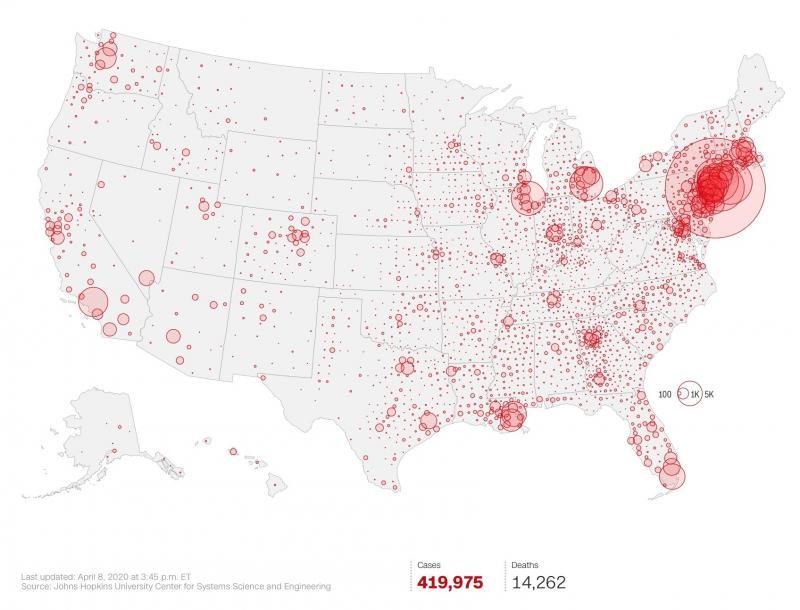
We don’t have any traditional leading indicators for this crisis, but we can look at the timing of how events transpired in other countries to predict what the rebound might look like. As expected, the use case that gets talked about most is China. Can we use China as a use case for the United States? The simple answer would be, yes; we can use China as a leading indicator because they stand at an advanced position in terms of virus growth by around 2 months. Therefore, we can predict just how bad things are going to be at their worst and, more importantly, what the recovery is going to look like on the backside. However, the answer is much more complicated than a simple, yes.
In studying Chinese economic contraction as well as recovery, we must decide which data in China that we can say is mimicked across other countries that experienced pandemic breakout after China. There are some health metrics that we could look at. The obvious ones include looking at the total number of cases per 1,000,000 in China compared to other countries. We can also talk about the days between the initial spread and the day of peak cases, now that there’s been some talk that perhaps the U.S. is reaching its single-day peak in new cases very soon.
What we learn is that the gap between China, which we’re showing here in a neutral color, compared against other countries is that the comparisons vary widely.
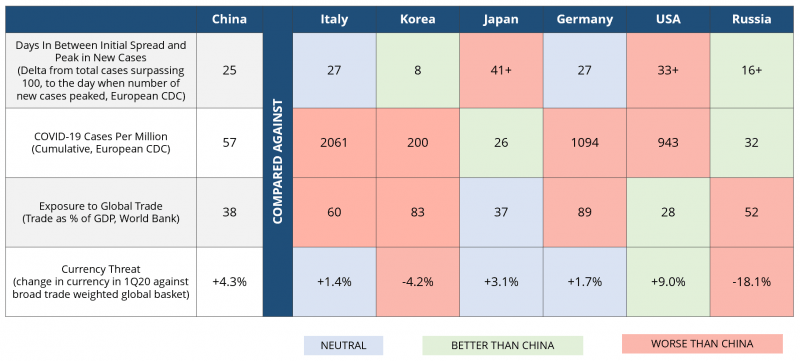
The number of days between that initial spread and the peak number of new cases in Italy and Germany were similar to China. But the comparisons fall apart when you look at total cases-per-million as the spread of the virus each day was much more severe than in China and led to strong shutdown efforts. That’s what crippled the Italian economy. For similar reasons, Germany is not far behind.
When we also look at cases per 1,000,000, the total number of cumulus cases in China was about 57 per 1,000,000. Most countries have long surpassed that, including the U.S., where it’s about 143 cases per 1,000,000. These are not comparable or fair barometers, because a mandated shutdown to prevent spread will negatively impact the economy regardless of the number of cases.
If we look for other metrics, we see that Korea managed to peak in new cases eight days after the total number of cases surpassed 100, which is quite impressive. However, its exposure to global trade or the devaluation of its currency since the crisis began, we see that Korea has multiple facets of its economy which continue to be threatened even though it was an early mover in the health crisis.
Economic Fallout
It’s not necessarily the cases per 1,000,000 that matters, but it’s the fallout from the social policies that are mandated to curb or flatten the curve. We can conclude that cases per 1,000,000 is not a very good metric when we think about additional metrics from China and other countries.
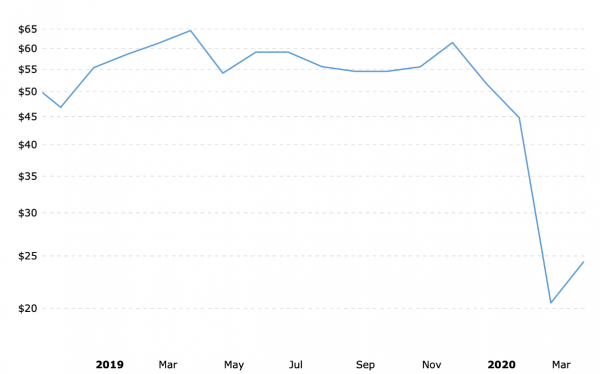
Increasingly this is turning into an economic crisis all on its own separate from the health crisis. We’re looking at the fallout from oil countries, including Russia, with its relatively low number of COVID-19 cases and its exposure to global trade at 52 percent of GDP, which is much higher than China’s, and its currency, which has significantly more threatened than China’s. The economic fallout from just these two events, regardless of the health crisis, is going to be much more severe now that Russia and other oil countries are also imposing some shelter in place policies.
In Italy, for example, the health crisis is much more severe, and they also have more substantial exposure to global trade. Korea, on the other hand, has not had such a severe health crisis based on early containment measures. However, the economic crisis they’re going to face will have much more significant challenges when it comes to their currency and exposure to global trade.
In the U.S. we have favorable conditions when it comes to our low exposure to global trade and the fact that the dollar is a safe-haven—we’ve seen more robust dollar growth against our trade partners than China has seen. However, the health crisis has drawn on. We’ve been experiencing prolonged exposure for more days, and there are yet more days to come which will further drag on the economic crisis.
The lessons learned are that there are enough differences between the health metrics and the economic metrics of any given country to challenge the assertion that economic recovery is going to be ‘mirrored’ to the recovery China is seeing.
The financial unraveling due to this coronavirus
Many economies that have seen a less severe health crisis to date are facing significant currency crises, including Russia, where we see a drastic decline in currency valuation. The stress on the currency in Russia is largely due to falling oil prices, which have negative ramifications for Russia as an economy and as a trading partner. However, we need to consider that while we might be having conversations in the U.S. and Europe about long periods of deflation and how to stimulate consumer spending during a deflationary crisis, a lot of other countries are really going to be seeing the opposite.
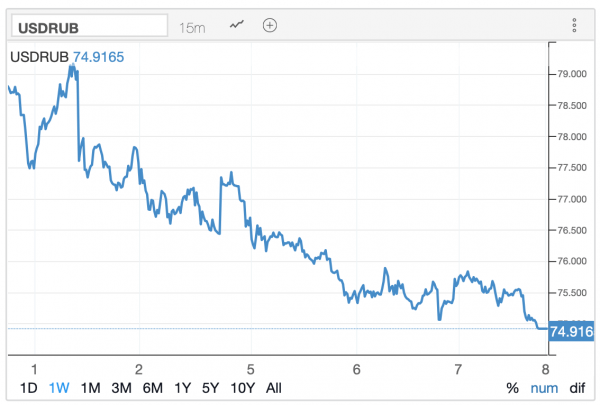
There is a likely significant near-term threat of inflation because their currency has dropped almost 20% in just three months. We’re also seeing other emerging markets and oil-driven markets experience significant hits to their currencies. This will likely incur inflationary impacts and threaten economic systems that rely on stable exchange rates to see economic gains.
PRICE OF CRUDE PER BARREL
There is no one silver bullet leading indicator coming out of China to compare to U.S. economic conditions. When we want to look for global indicators, the Purchasing Managers’ Index (PMI) has received a lot of headline news for a reason. They offer valuable leading indicators that tend to come out on the early side of every month for data for the month previous—a lot earlier than some of the government statistics. As we look to the second half of the year, we see that the economic pain looks consistent across both manufacturing and services, across countries that saw both high volumes of COVID-19 cases and low.

February data in China, as the economy began to shut down, provided early indications of the backward economic slide. From March data, we learn that things are still relatively bad, especially by China’s standards, as we see manufacturing in a neutral position or services below 50. A lot of these March numbers out of China are the second-worst readings on record (only behind February). The good news is that March has improved over February.
This makes sense as the U.S. moves through its health crisis experience, and our shelter in place policies eventually get lifted, hopefully by next month. People will be able to go back to work, and we will start to see economic indicators move up from crisis mode. What we’re probably going to learn from this, as we watch data from China, is it’s about that “relative” recovery. Are things really going to get back to “normal” or are things going to look like a “better-than-the-crisis but nowhere near pre-crisis levels?” We’re going to probably be exposed to the latter as we watch China move through its recovery see how challenging it is to restart after a shutdown, even one that has a long history of strong economic growth.
Currently, March numbers being published around the world are all reflecting either early crisis or mid-crisis periods, depending on what country you are speaking of outside of China. The numbers are going to improve—they’re going to have to—most of them are at either record lows or the worst. However, there’s going to be a high likelihood that you’re not going to see these numbers get back up to pre-recession levels anytime soon. And when we say not anytime soon, that means not for multiple quarters out into the future. We think that global growth is going to be suppressed in the second half of the year.
Challenges in Using China as a Harbinger
What are some of the other challenges if you use China as a leading indicator?
Data integrity: Comparisons can get complicated when you consider the data quality coming out of China. It’s challenging because, at times, we have a mix of public and private sources that are more restricted than in other countries, which means we really must be careful when we’re trying to get precise statistical measurements coming out of China.
Growth Market: Secondly, China still has a record of emerging-market-like historical growth which makes it very hard to compare against developed nations such as in Europe or the U.S. For example, China total retail sales have seen online sales growth of 15% -20% year-on-year steadily leading up to this crisis. When you consider online sales have reduced to a lower number of 3% year-on-year growth, we’re looking at a drastic decline by Chinese standards. However, by U.S. developed-economy standards, we could easily expect numbers going much lower than what we see out of China. When we look for Chinese economic recovery, there might be some false positive signals if we’re trying to compare to developed nations simply because of the economic momentum that an emerging market has versus a developed economy. We’re going to have to knock down those expectations a little bit.
Government Policy: The third challenge is a big one, as it depends on how much government control a nation has over the business environment, and how much they apply that control to this crisis. There are going to be different government policies, reactions, and market systems that are going to be in play in the U.S. or Europe compared to China. China imposes heavy government oversight and can fundamentally control employment and wages and debt levels in ways that the private sector cannot. We’ve always mentioned that one of the big concerns in the U.S. about this economic recession turning into something much more significant if it turns into a financial crisis. We’ve seen unprecedented actions by the U.S. Federal Reserve to try to stop financial contagion from making this crisis any worse than it is. China will take a different course of action than the US or Europe, and that may make its economic recovery different.
Conclusion
It may be tempting to lean on China as a 1-2 month leading indicator for forecasting and planning in other parts of the world when there is so much uncertainty. However, when we consider that the Chinese recovery may be different because of government policy, its middle-emerging economic status, the differences in exposure to commodity prices and exchange rate fluctuations, there is a lot to consider that may skew the comparison. Given all these caveats, China may not make the best leading indicator for our domestic economy and those of our neighbors. As we monitor data, we will continue to watch multiple types of economic and financial information to determine how economies are going to turn around. But, with all said, it’s probably best to look at domestic indicators rather than look abroad for the early signs of economic recovery.
***
 In the wake of the COVID-19 pandemic, it is now more important than ever to have access to trusted data and expert economic analysis to help guide strategic decision making and business planning.
To meet this need, Prevedere is unveiling its Economic Outlook Weekly report, with a complimentary package focused on COVID-19. There is no charge for access to leading indicators as they matter updated weekly.
Complimentary COVID-19 Economic Outlook Weekly includes:
- Macro view of COVID-19 global economic impact
- Key leading indicators to watch
- Regular economist presentations offered as information becomes available
- Weekly updates sent to your inbox
Click here to learn more.
***
About Andrew Duguay – Chief Economist Prevedere, Inc.
 Mr. Duguay is a Chief Economist for Prevedere, a predictive analytics company that helps provides business leaders a real-time insight into their company’s future performance. Prior to his role at Prevedere, Andrew was a Senior Economist at ITR Economics. Andrew’s commentary and expertise have been featured in NPR, Reuters, and other publications. Andrew has an MBA and a degree in Economics. He has received a Certificate in Professional Forecasting from the Institute for Business Forecasting and Certificates in Economic Measurement, Applied Econometrics, and Time-Series Analysis and Forecasting from the National Association for Business Economics.