Last Updated: April 21, 2022
Part 4 – Data Scientist View of Intelligent Forecasting
Welcome to the 4th post in our series. In part 1, we introduced the concept and practice of Intelligent Forecasting. Part 2 presented the people/roles in the organization who benefit, and part 3 explored the industries that leverage the actual forecasts and resulting economic intelligence. This post will open the hood on the mechanics and algorithms that drive the Intelligent Forecasting process.
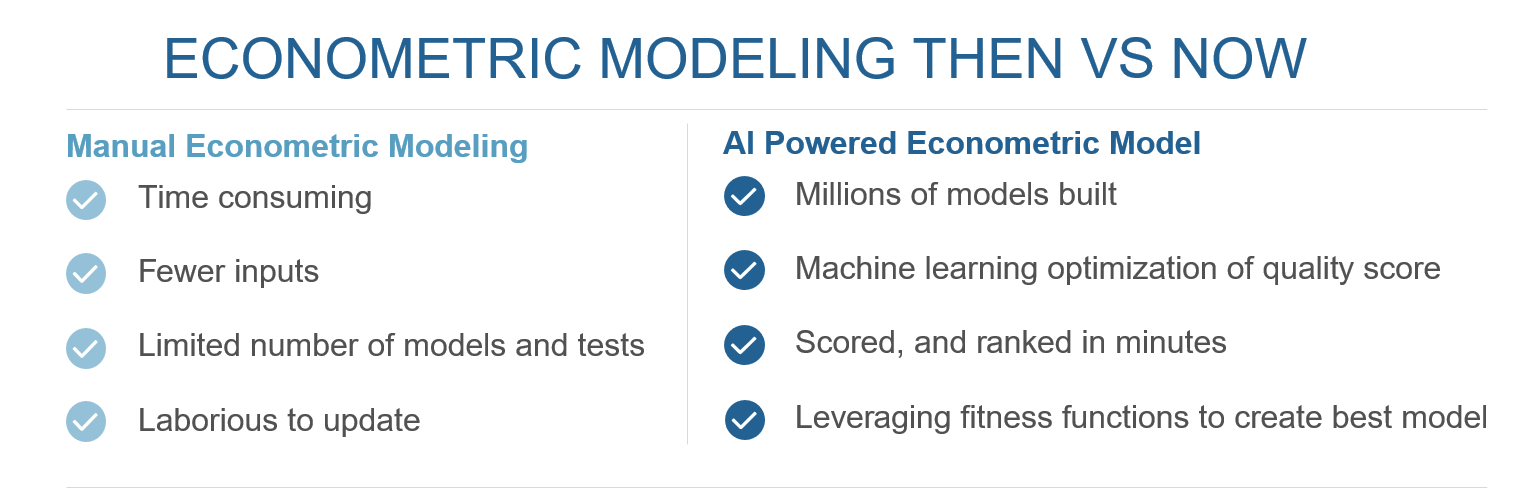
Intelligent Forecasting as a practice has emerged thanks to the perfect gathering storm of big data, artificial intelligence and the scalable power of cloud computing. Machine learning has supercharged the ability of forecasters to leverage econometric modeling at scale, to the point where accurate performance predictions are possible, based on millions of economic leading indicators and model refinements.
Many will not be familiar with econometric modeling, but the practice has been around for decades. It is widely regarded as the most accurate method for predictive modeling (compared to, say, ARIMA or exponential smoothing), but historically it has been too manual, time-consuming and expensive to be of practical value. Access to a wealth of economic data and massive computing power has delivered the shot in the arm needed to bring econometric modeling into the mainstream.
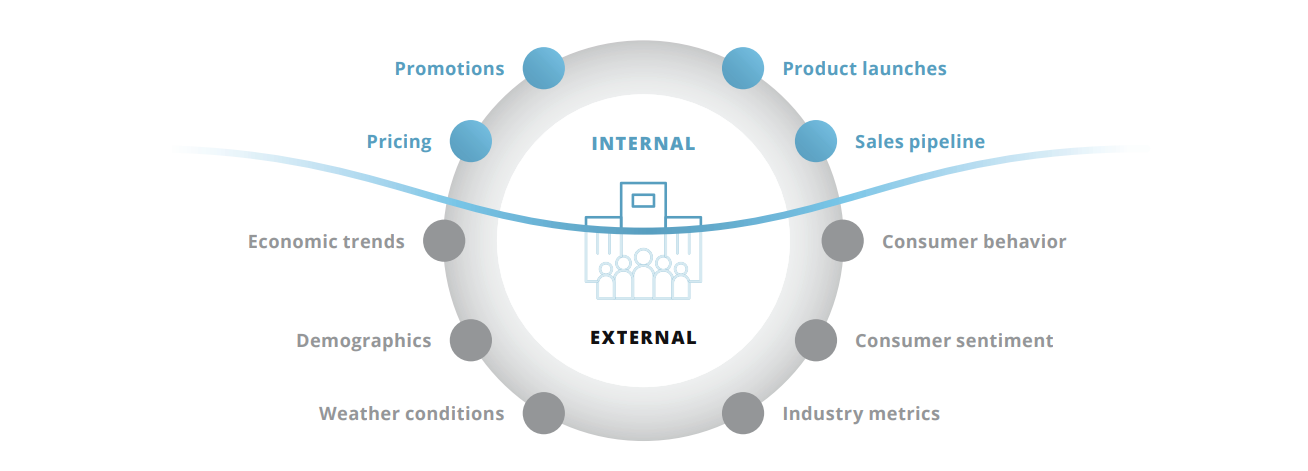
Data is the fuel for the Intelligent Forecasting engine. Millions of data sources related to markets, industry, weather, trade policy, geopolitics, macroeconomics, consumer behavior etc, can now be part of the modeling process. Where traditional forecasting leverages internal variables, Intelligent Forecasting identifies and leverages external dynamics, with a focus on those that significantly influence business performance.
If you have had the chance to review the prior posts in this series, you will likely know that Prevedere’s Intelligent Forecasting platform leverages a repository of internal + external data, neural network classification, correlation analysis and econometric modeling. The objective and outcome is to be able to identify, create, refine and leverage predictive models to comprehend future business risk, opportunity and performance.
Just to remind you, the Prevedere process has four main steps, as summarized in this diagram:
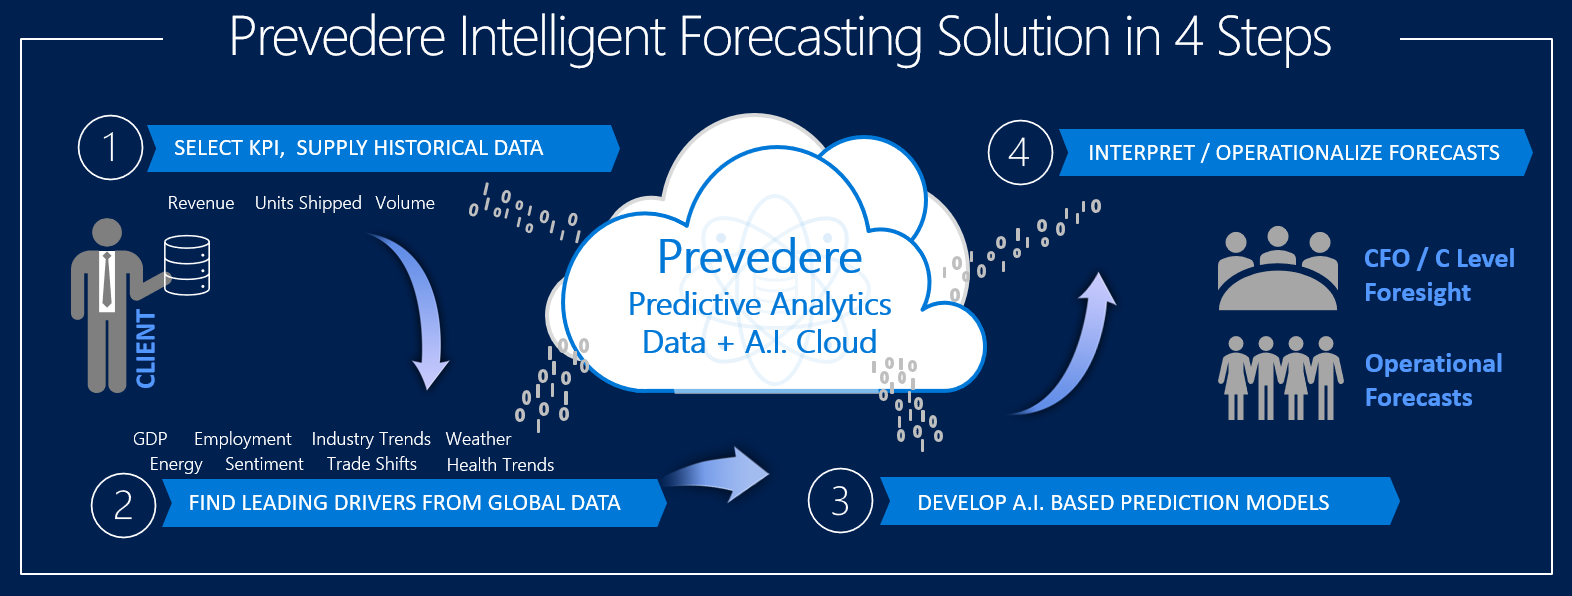
The data science really starts in step 2.
- STEP 1: We request 36-60 months of historical performance data related to the metric to be forecasted, e.g. sales, units, inventory. We also need the context of the data, whether it is for all segments/products or a subset, which sales channel(s), which geographic area and so on.
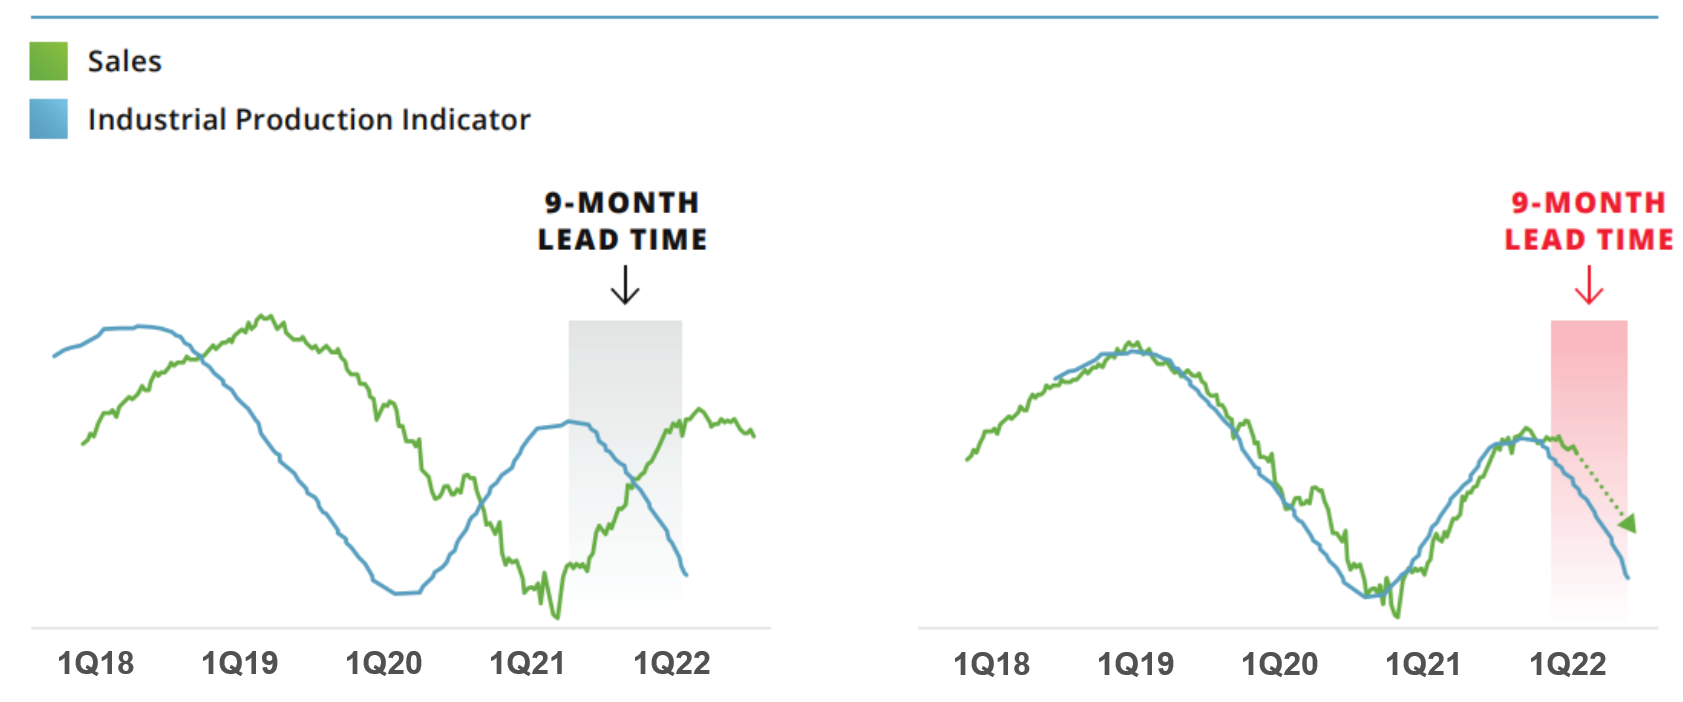
- STEP 2: identifies which external leading indicators are unique to your performance data. The data provided by the client is compared to over 3 million time-series data sources in the Prevedere global data repository, and a correlation analysis is performed. We are looking for those sources that statistically match (either positively or negatively) that also present a lead/lag signal for predictive use. For example, this industrial production indicator maintains strong correlation and we can see it leads this company’s sales by 9 months.

The analysis might initially present hundreds or thousands of prospective indicators, that can then be filtered by correlation strength, and by context, e.g. geography, industry, scope, channel. The outcome might be 10-30 market drivers that are closely related, each with its own lead/lag timeframe, anywhere from 1 month to 18 months. Clients are often surprised by indicators that are predictors of their business. Some are obvious, others less so, e.g. wage increases before luxury good purchases, employment in garden supply stores as an indicator of propane tank sales, alcohol consumption as an indicator of construction staffing levels. Bottom line is that each company, each brand and each category has a unique set of leading indicators that most consistently happen in advance of the company’s own change in performance. - STEP 3: involves the taking of those indicators and building predictive models, which ultimately results in an economic baseline forecast. Sounds simple enough, but this is where machine learning algorithms and computing power excel. First of all, which of those 10-30 indicators do you decide to include in the regression analysis to accurately determine the 12-18 month prediction, or 3 year CAGR? One approach might be to experiment, and build multiple models, but this is an arduous process if you are looking to code this in R or Python and build/test models one at a time.
The Prevedere analytics engine creates hundreds of predictive models based on various permutations and combinations of those indicators. Machine learning algorithms enable each subsequent model to learn from the last, reducing errors until the model with the best score is presented. Below is a US Agriculture example showing the model with the best quality score, which is a weighted aggregation of multiple model performance stats listed below the chart, which include Predictive R Squared, Durbin Watson, Holdout MAPE and In Sample MAPE.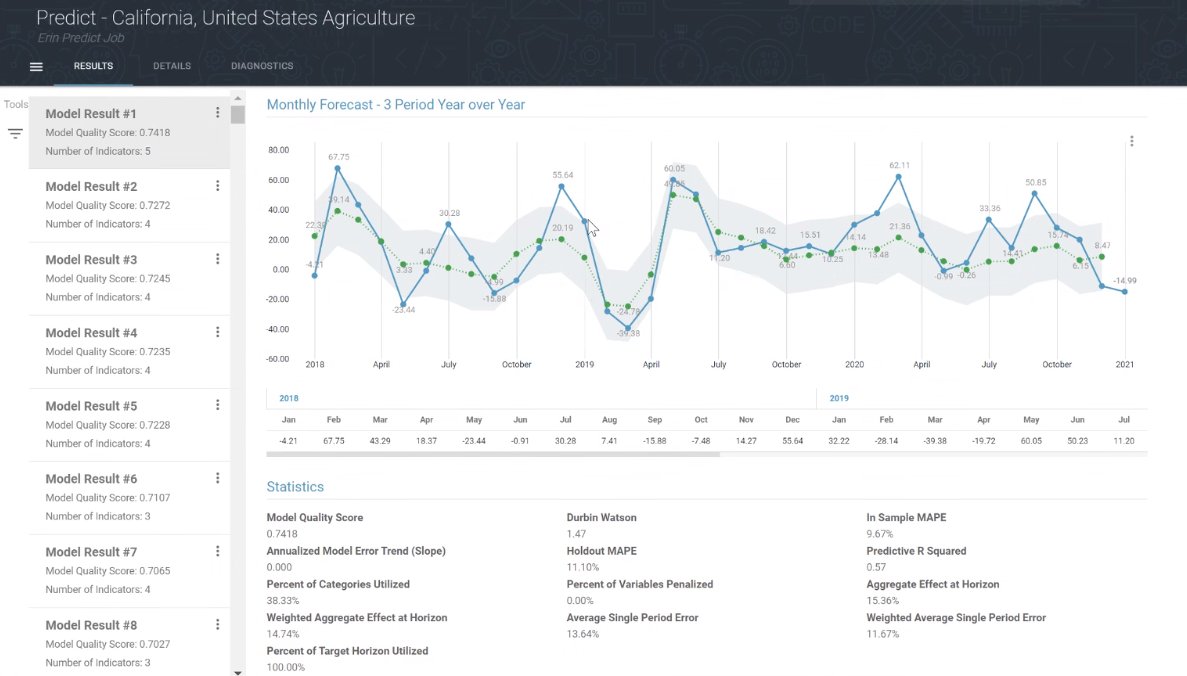

These types of econometric models, when generated with sufficient horsepower and optimization, can be extremely accurate predictors of future business performance. The resulting forecasts, offer an objective view of future outcomes based on current economic, industry, and consumer trends. This method is not targeted at SKU level forecasting or more granular analysis, because the indicators are broader and economic in nature. Our lowest level of prediction is at MSA or city level. Intelligent Forecasts are also leveraged in parallel with internally generated forecasts, providing a barometer of where external factors are driving your business. It is not typically a replacement for internally developed forecasts. Nor will it ever be 100 percent precise, but it is critical to those business leaders who need both a guard rail for internal forecasts, and a strategic assessment of their economic conditions ahead. - STEP 4: Our team of senior economists and data scientists help companies build their intelligent forecasting capabilities, and interpret the results. They are experts in econometric modeling and can develop, review, interpret, and maintain custom forecasts. They work with clients’ data science teams, and complement existing advanced analytics initiatives. Intelligent Forecasts are often integrated into planning and ERP systems, or even analytics systems for downstream use. Prevedere has created risk and impact dashboards that enable a real-time view of forecasts and impact. Models can be refreshed at any time, typically as internal and external data sources refresh.
An Intelligent Forecast tells a story, not just of the monthly or quarterly future data points, but of the upcoming winds in the economy. With insight into the causal factors of a forecast, strategic planners and executives can plan for upcoming headwinds and tailwinds: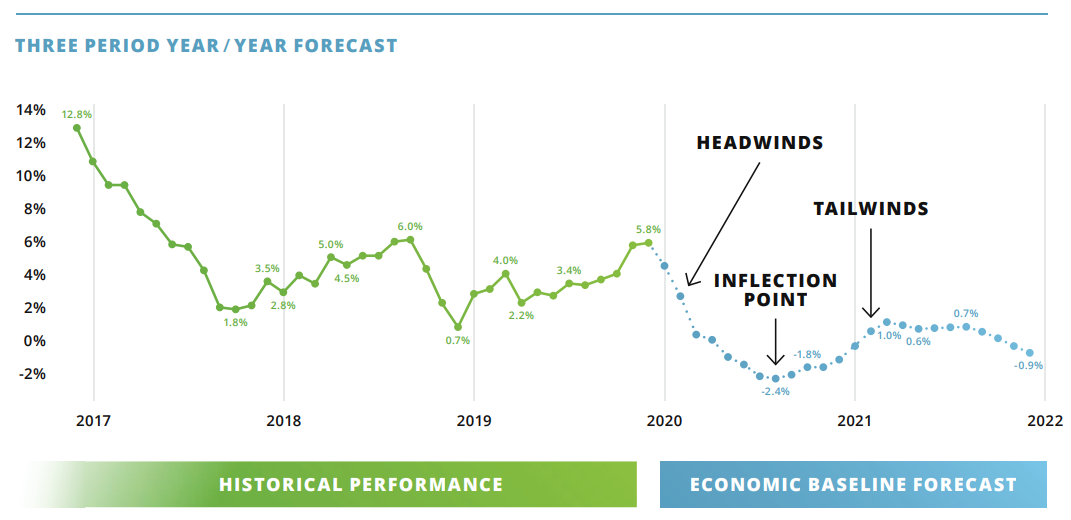

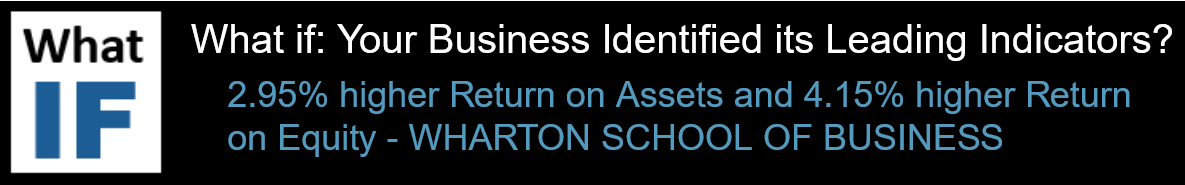
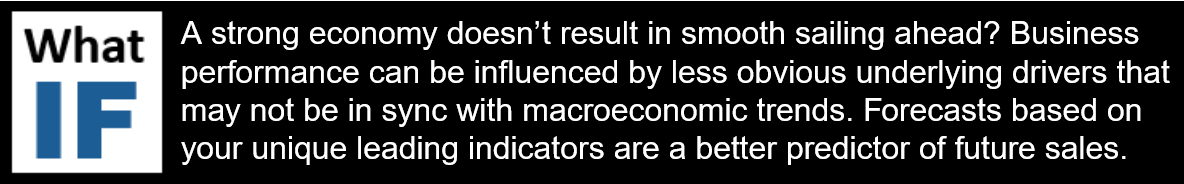
A Couple of What-Ifs to Consider:
Conclusion – Do it Yourself or Leverage a Platform?
As noted in a previous What-If post, it may be possible for internal teams of data analysts and data scientists to actually develop Intelligent Forecasting solutions manually, but they would face two key challenges. The first is to identify, access, prepare and correlate the hundreds of potential external data sources that are used to kick start the economic prediction model process. Teams could spend months wrangling this external data only to find no statistical relevance to the business problem they were tasked to solve. Intelligent Forecasting solutions providers such as Prevedere typically offer an external data repository, with thousands, sometimes millions of external sources that are primed for modeling.
The second challenge is the time it would take to build and test the predictive models, applying specific machine learning algorithms used to improve forecast accuracy. This What-If question is perhaps the key reason to leverage a platform that is built from the ground up for econometric based predictive modeling:
We hope that this series will continue to be of interest and value to you. Below is a list of the posts, and also a recommended piece of content that offers more insight into this topic.
- Part 1 – Introduction and Overview
- Part 2 – Who Benefits Most from Intelligent Forecasting
- Part 3 – Which Industries Leverage Intelligent Forecasting
- Part 4 – Data Scientist View of Intelligent Forecasting (this post)
Content Recommendations
- Video
Dr. Barry Keating, a Notre Dame University professor, and 30-year forecasting practitioner leverages his personal experiences and shares his take on traditional forecasting methods and the Prevedere econometric approach.
Thanks for your time today.
Watch out for the series finale: “Conclusions, The Future, How to Get Started”.s